Help
Available Layers
- Skyways: Simply displays all valid flights stacked on top of each other.
- Certainty: Marks areas where there is enough information available for thermal maps to be meaningful. Thermal maps only work in areas with sufficient flights.
- Thermals: Indicates the probability of finding a thermal with a paraglider, given that it can reach the area while flying. The hotter the area appears, the likelier it becomes to find updraft. However, if it is raining heavily, thermal maps will not provide reasonable predictions.
- Hotspots: Identifies centers of areas with a high thermal probability. While of inferior quality compared to thermal maps, hotspots are supported on many flight computers.
- TimeFilter: Allows for limiting previous layers to a specific time of year and/or time of day.
- Time of year: Always considers three consecutive months (with a linear overlap of one month into the next quarter).
- Time of day: Defined by the time elapsed since sunrise, with morning being defined as 0-6 hours after sunrise, midday being 6-10 hours after sunrise, and evening being later.

Trigger Points
A thermal trigger point is a theoretical spot on the surface where heated air parcels detach from the ground. Wind shift in flyable heights is approximated linearly. A pilot must be aware of winds to effectively encounter the thermal. Weather properties such as wind speed, altitude of the cloud base, air gradient, and so on depend on the given day. However, trigger points (mostly) remain consistent.
Weather Impact
Surprisingly, global weather conditions are of minor importance when it comes to finding the thermal trigger point. However, weather is very important for paragliders, as pilots mainly choose their flying areas based on the conditions. In a given area, most flights are performed under very similar conditions, and the positions of the trigger points are roughly the same. The wind component is minimized by reducing thermals to trigger points as much as possible.
Map Quality
The main factor for good thermal maps is the flight density in a given area. It was also discovered that maps are generally better if the topology is the main thermal factor. In some regions, only sparse thermal predictions can be shown, since there is only little information available. For example, in the flatlands, the prediction quality is generally lower, since there are fewer flights and most of them are performed according to cloud position and not according to static trigger points on the surface. Regions with sparse information were kept transparent to reduce clutter. Furthermore, thermals next to popular launch pads are mostly overrated (the position, however, is correct). This is caused by the fact that most pilots only upload a flight if they at least catch the first thermal.
Recommended Map Usage
First of all, very good pilots who are familiar with a certain flight area barely benefit from the maps. But they have proven to be useful for studying a previously unknown area. Like: where do I find my first thermal? Thermal probability is a good idea if no other signs for thermals are available. If one sees a beautiful cumulus, a climbing bird, or even other climbing pilots, one has to blame oneself for preferring to follow the thermal maps. A second purpose is the analysis of performed flights (which is especially interesting in 3D) in order to optimize tactical decisions made by other pilots in previous flights.
Can you create better maps for [my remote location]?
Simply do more and longer flights in this area. Only XC flights are considered (based on a minimum distance) and only thermal flights will contribute to the thermal maps. Soaring is filtered out wherever possible. In order to reduce thermal outlyers the current probability model requires a minimum flight density of around 20 flight per 100m square (that's a lot!).
Finally, upload your flight to any of the main contest sites which allow access to the raw igc. Namely, any leonardo based server like paraglidingforum or the international XContest (but not closed systems like OLC).
Cool, where can I find further reading?
This project started off as a master thesis " ParaglidingNet - A Sensor Network for Thermal Research ". From this a paper called " Ikarus: large-scale participatory sensing at high altitudes " emerged (it's more technically oriented and less to paragliding). But seriously; this is a lot of theory on sensor networking and such. But what really mattered was to create an open map database for every paragliding pilot out there and to provide simple tools to improve everyone's flights.
Do note, however, that in the time since this thesis was written the toold and methods used where heavily optimized and extended to new regions.
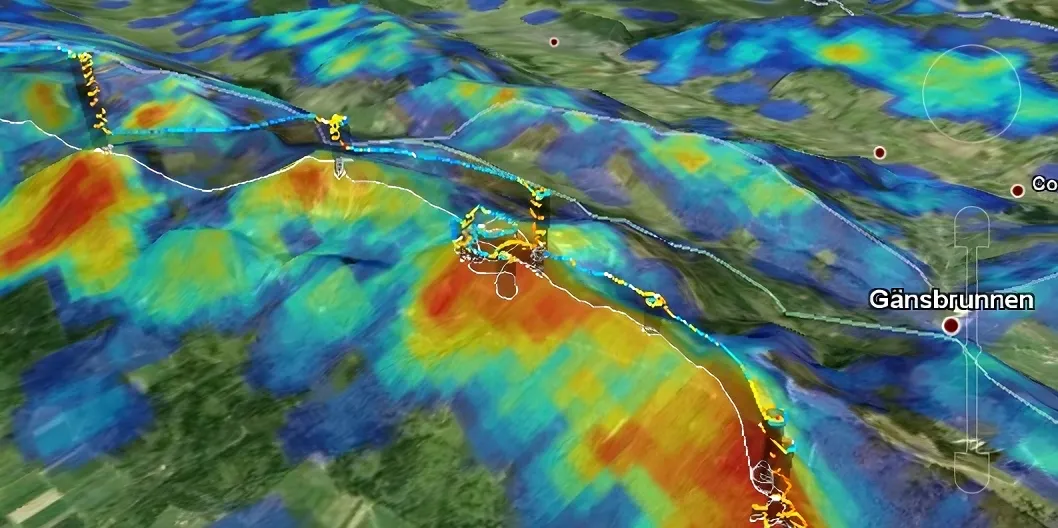
GoogleEarth Thermal Layers
You can view thermal maps directly in Google Earth . The 3D view is especially helpful for analyzing past flights and detecting alternative routes or possible mistakes. Google Earth Mobile Editions don't provide dynamic layer switches. Download a more limited version that provides the unfiltered thermal layer only.
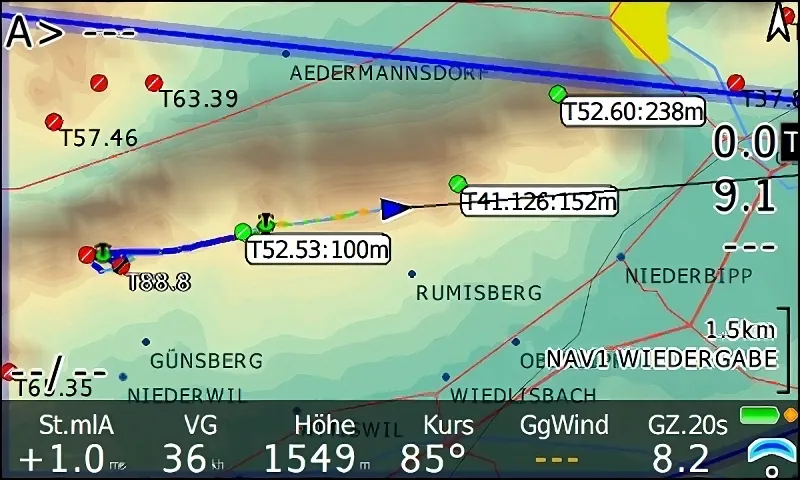
Download Hotspots
Unfortunately, traditional GPS devices and flight computers cannot display the thermal maps as raster data. Thermal hotspots, representing the central regions of high updraft probability, are a vectorized extract of the same data that can be uploaded to most devices. Choose a format suited for your device and limit the number of hotspots so they do not clutter your flight area.
Which format should I choose?
Many tactical flight computers like XCSoar , Freeflight or LK8000 have the option to show hotspots as dedicated thermal locations. Pick "SeeYou Waypoint thermals (cup)" in these cases.
It is not advised to use the WPT format on any device except the ones supporting only WPT like older editions of Skytraxx 2.0 . For any other device use the standardized GPX format if supported or CUP otherwise.
Paragliding pilots flying an LK8000 have to option to visualize thermal hotspots as airfields. This will color hotspots depending on if they are still within reach with your current glide ratio. Pick "SeeYou Waypoint airfields (cup)" in this case. Since LK version 4.0 you have to enable the option "alternative landing fields" (under Setup → 11 Appearance)
License and Code
The Paragliding Thermal Maps Project by M. von Känel is licensed under a Creative Commons Attribution-NonCommercial-ShareAlike 4.0 International License .
If you plan on including thermal tiles into your own map server contact me directly with your expected load. For tracking purposes every remote request has to append an additional &src=[hostname] URL parameter. Note that all tiles are in TMS orientation.
// A sample leaflet 1.x implementation of skyways
L.tileLayer('https://thermal.kk7.ch/tiles/skyways_all_all/{z}/{x}/{y}.png?src=' + window.location.hostname, {
	attribution: 'thermal.kk7.ch <a href="https://creativecommons.org/licenses/by-nc-sa/4.0/">CC-BY-NC-SA>/a>',
	maxNativeZoom: 13,
	tms: true,
});
L.tileLayer('https://thermal.kk7.ch/tiles/thermals_jul_07/{z}/{x}/{y}.png?src=' + window.location.hostname, {
	attribution: 'thermal.kk7.ch <a href="https://creativecommons.org/licenses/by-nc-sa/4.0/">CC-BY-NC-SA>/a>',
	maxNativeZoom: 12,
	tms: true,
});
Keep Soaring!
Creating these thermal maps is like chasing the wind itself - it takes months of my spare time, enough CPU heat to warm a small ridge, and a server that's seen more action than a skydiving instructor. While I'm committed to this project like a bird to the sky, your support keeps my wings flapping happily. Whether it's sharing your adventures or helping me refill my 'fuel tanks' with server funds, disk space, or even a cold one for those post-gliding reflections.
Cheers and happy landings!

Contact
To reach me, send a mail to "info" at **7.ch.
You'll probably guess it from the domain name, but robots won't.
Statistics
There are currently a total of 2,855,594 valid flights in the kk7-database. Usually only flights above 10km are fetched and only flights with a minimum quality standard are kept. 2,554,276 of those flights contain a thermal, which is about 89%. Last time we did check for new flights was on 2024-03-14 and the maps/hotspots where last updated on 2024-03-15. Pilots flew a combined time of more than 690 years and 110 days. They did catch about 20,669,477 thermals (8 per thermal-flight) and climbed for more than 221 years and 183 days. During that time they gained over 7,056,818km, which is more than 17 times to the moon.
Flight sources
- xcontest
- DHV-XC
- International Leonardo
- FFVL - Fédération française de vol libre
- XC League - UK
- FAVL - Federacion Argentina de Vuelo Libre
- ypforum - Türkiye Yamaç Paraşütü
- Bulgarian SkyNomad
- flightlog.org
- PG Leonardo - Czech
- Luxembourg Hang & Paragliding Championship
- and many more that went offline in the meantime...
Thermal maps used by thirdparties
- ThermiXC
- burnair
- XCTrack
- Ogoy
- FlyXC.app
- SpotAiR
- SkySight
- spedmo
- paraglidingMap
- where2fly - iPhone App
- dotmana - xcsoar skyways
- soaringmeteo - soarGFS
- Thermikwolke (missing BY-NC-SA)
- On most Leonardo based servers